No experiments on production
No changes to the theme, plugins or database. The store sells every day, so every fix had to be reversible within seconds.
case study · WooCommerce optimisation
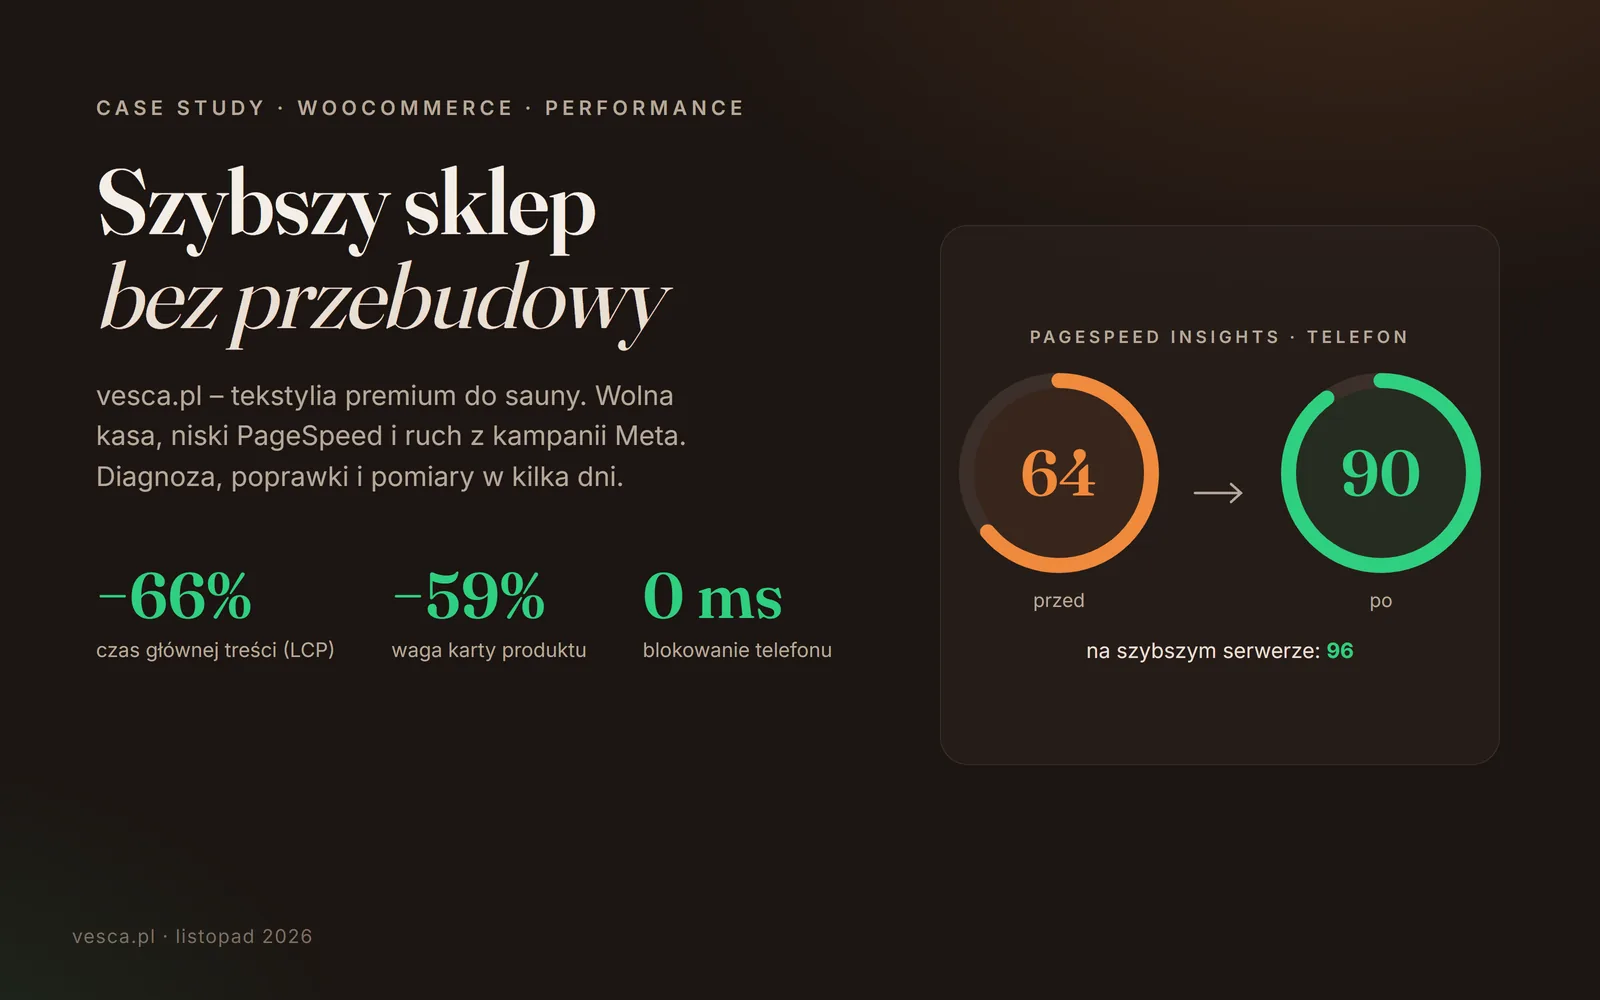
vesca.pl sells sauna textiles, mostly through Meta campaigns and almost entirely to phone users. Checkout was sluggish and PageSpeed rated the store 64/100. Within a few days checkout got faster and PageSpeed went up, with no changes to the theme, plugins or database.
01 / challenge
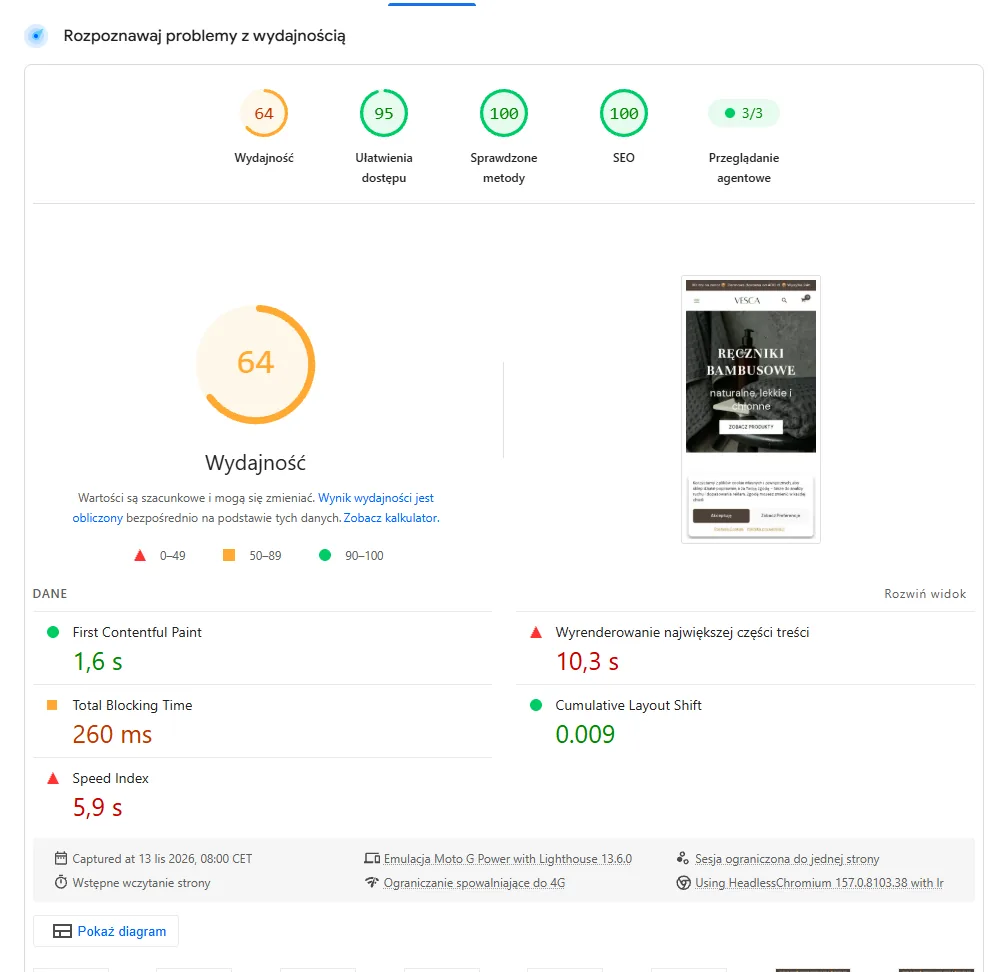
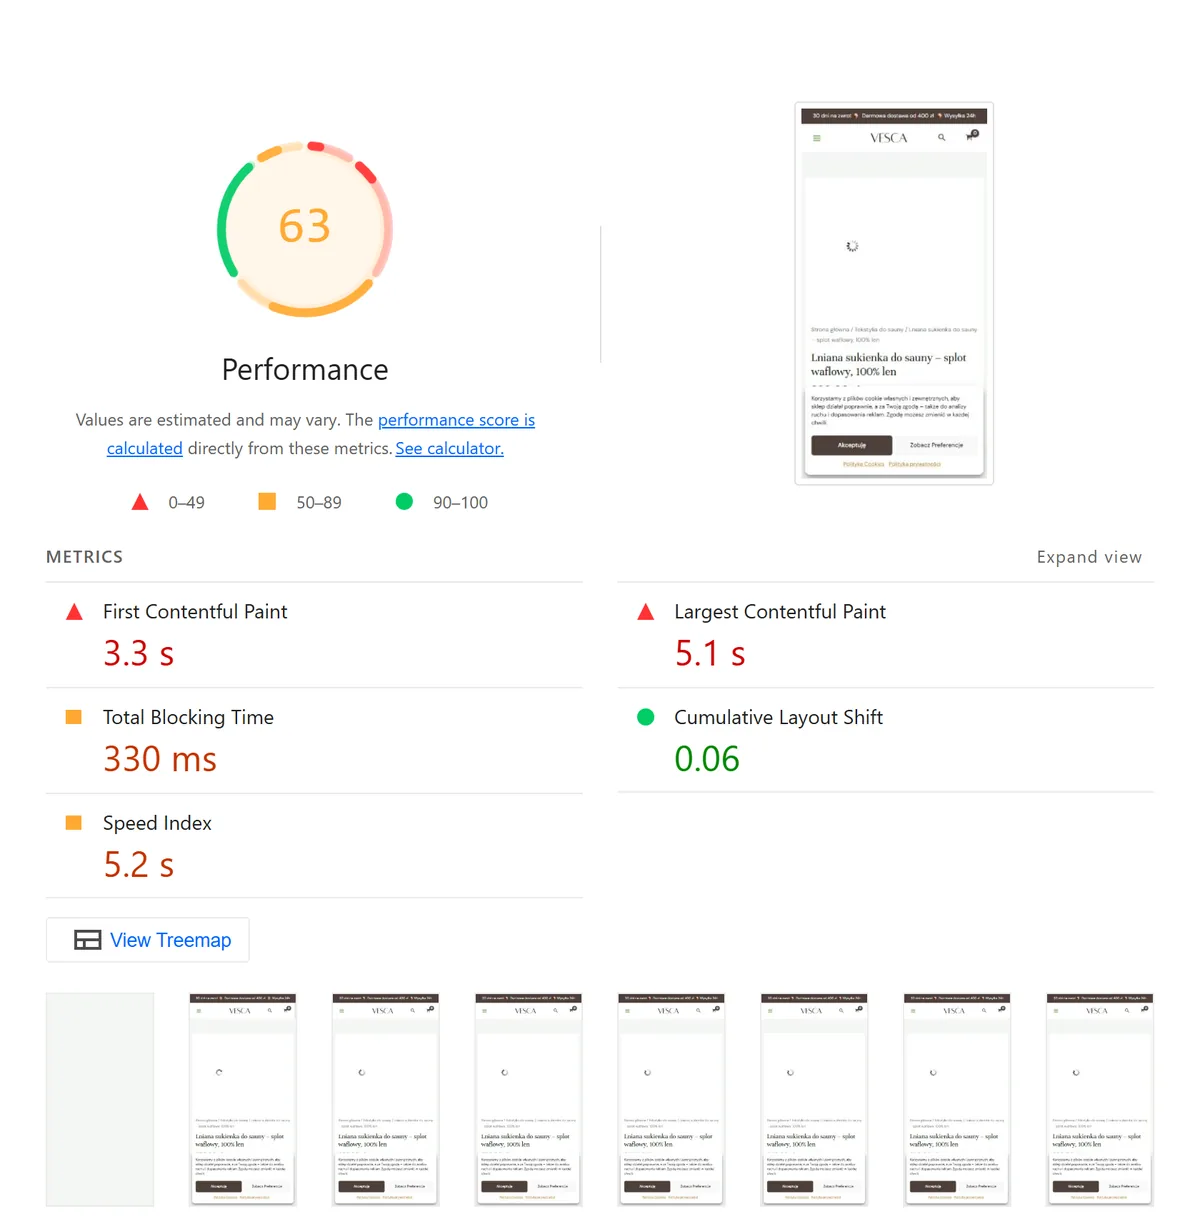
Traffic arrives in waves from ads, almost all of it on phones. The owner reported a slow cart and checkout, and a page that could freeze after a minute of typing in details. PageSpeed Insights showed an orange score, as low as 53 in one run.
No changes to the theme, plugins or database. The store sells every day, so every fix had to be reversible within seconds.
GA4, Meta, Klaviyo and Triple Whale drive the campaigns, and Apple Pay and Google Pay are what customers expect. They could be delayed, not removed.
Cart and checkout that never wait on third-party services and never freeze while the customer types.
A 90+ mobile score and a clear, measured answer to how much a better server would help.
02 / method
03 / stage 1 · cart and checkout
On every checkout recalculation, such as a change of shipping method or postcode, the PayU plugin fetched the list of payment methods from PayU's servers. It cached the list for only 60 seconds, and not at all after an error. On slow shared hosting that meant over a second of waiting per step and a checkout that seemed to hang.
Scale: full width = 2 s. On a copy of the store on a faster server the same steps took 0.09–0.26 s.
04 / stage 2 · PageSpeed
Lighthouse reports and code coverage pointed to three causes. Tracking scripts loaded up front accounted for half the page weight and nearly all main-thread blocking. On top of that came a dozen stylesheets the page did not use, and the Google Pay and Apple Pay SDKs on every page.
05 / three templates
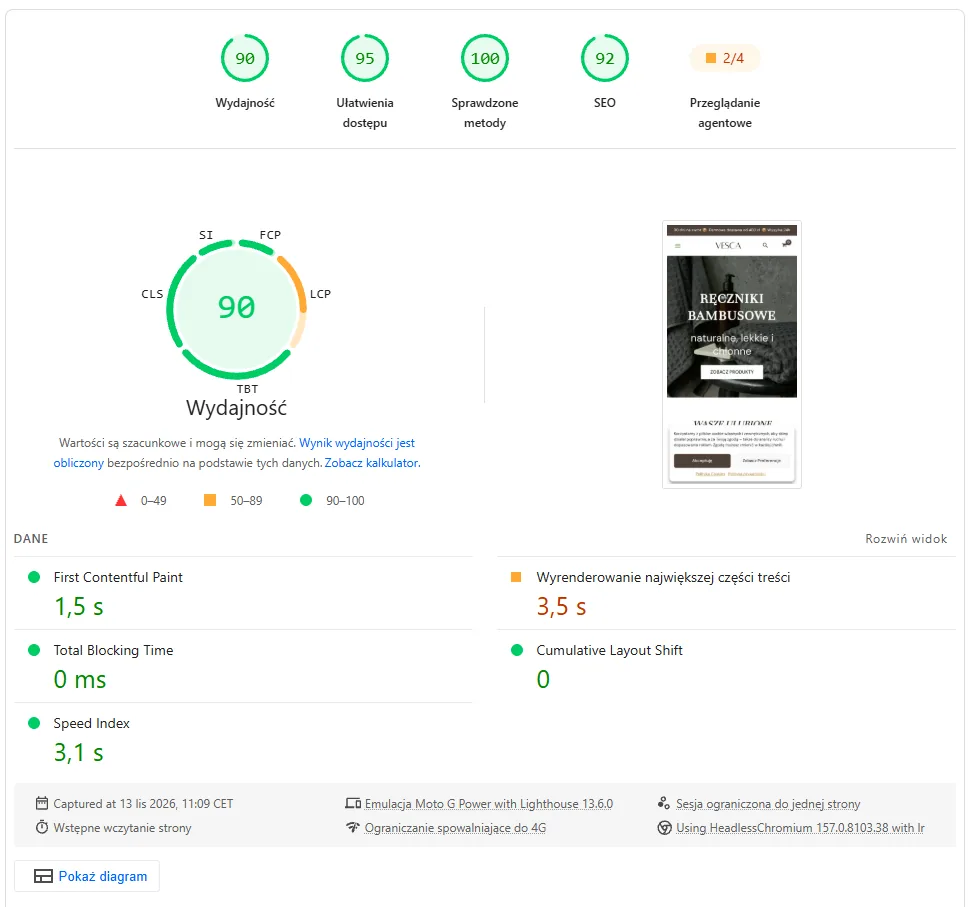
A single PageSpeed run can swing by a few points, so the results for the three page types are medians of three Lighthouse runs with PageSpeed Insights settings (mobile, slow 4G).
| Page | Score | LCP | Weight | Requests | Weight Δ |
|---|---|---|---|---|---|
| Home page | 73 → 88 | 5.3 → 3.5 s | 1,538 → 695 KB | 152 → 84 | −55% |
| Product page | 63 → 96 | 5.3 → 1.7 s | 2,250 → 933 KB | 192 → 112 | −59% |
| Category | 63 → 91 | 5.9 → 3.5 s | 2,022 → 550 KB | 146 → 69 | −73% |
06 / rejected experiment
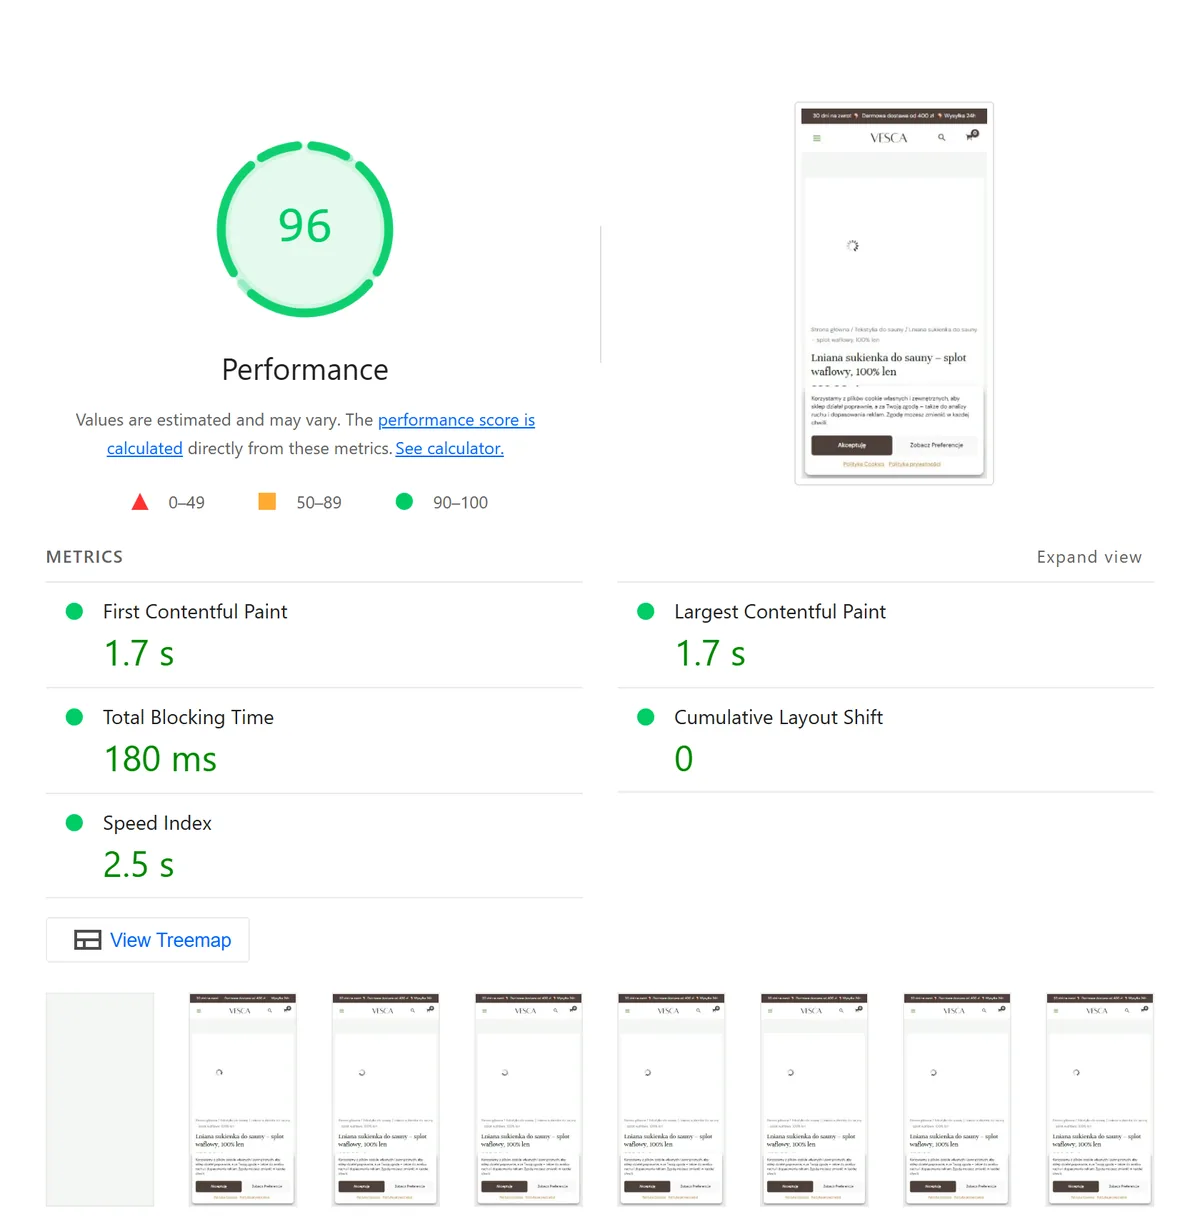
PageSpeed still flagged render-blocking resources (jQuery). So I tested deferring every script: zero JS errors and zero pixels of visual difference, and the warning disappeared. But the main content appeared later and the score did not improve. The change never reached production, because the measurement decides, not the list of warnings.
07 / hosting
A copy of the store with the same fixes went onto a VPS limited to 1.5 CPU and was measured right after production. The client received a comparison of WordPress hosting and VPS offers with the three-year cost at renewal prices, not just the introductory price.
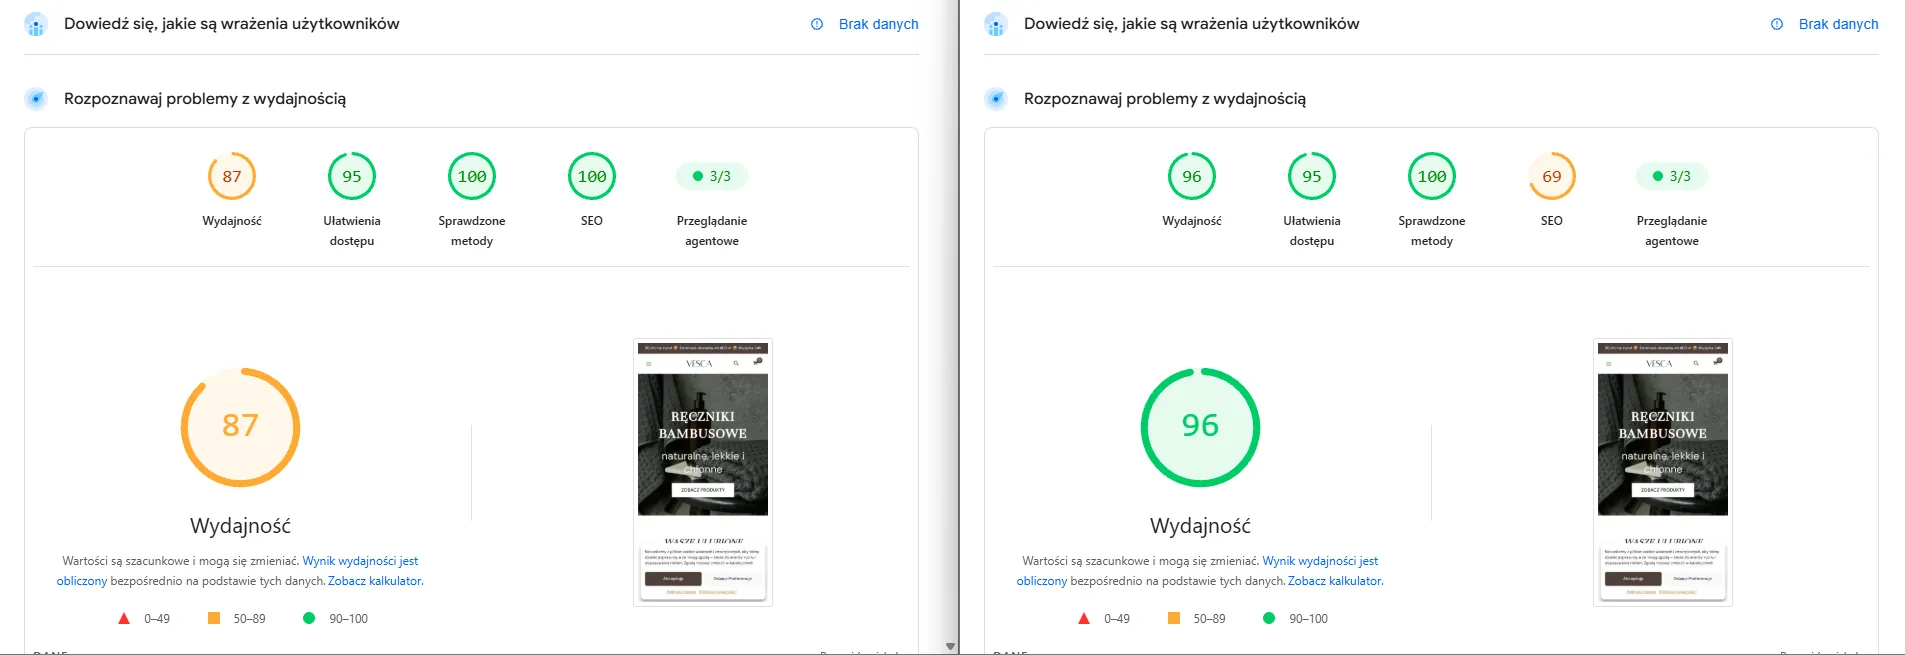
Cached pages gain mostly stability. On production the score hovers around 88; on the VPS it stays above 90.
Cart and checkout pages cannot be cached, so the server renders each one. This is where better hosting pays off most, exactly where the customer pays.
08 / bonus
Along the way I checked which scripts start before the visitor answers the consent banner (GDPR, Google Consent Mode v2). I prepared a fix in which script delaying works together with Complianz: marketing scripts wait for consent and load without errors once it is given. The whole flow was tested automatically on the store copy, before and after consent.
technologies and tools
Method: PageSpeed means Lighthouse with PSI settings (mobile emulation, slow 4G), medians of 3 runs; PSI screenshots are single runs, and the score varies by a few points between them. Checkout timings are server response times from the purchase replay script, 10 runs, no orders placed. The "before" checkout figures come from the initial audit and the client's own measurements, taken with a similar but not identical method.
next step
Tell me what you want to achieve. I'll come back with a concrete proposal, a quote and a delivery plan.